
A deep dive into the data reveals a world of growing concentration and underscores the critical need for a policy response to boost competitiveness
The 2025 EU Industrial R&D Investment Scoreboard shows a slowdown in the overall growth of R&D investment among EU companies. Contrary to this trend, the European health and energy sectors significantly increased their R&D investments, outperforming their global counterparts.
Published annually since 2004 by the European Commission’s Joint Research Centre, in collaboration with the Directorate-General for Research and Innovation, the EU Industrial R&D Investment Scoreboard compiles economic data from the latest financial reports of the world’s top 2,000 R&D investors. It also includes an expanded sample of the top 800 R&D investing companies headquartered in the EU. The investments of the companies covered in the Scoreboard represent nearly 90% of all privately funded R&D worldwide.
The Scoreboard holds a unique position due to its dual role as both a data source and a policy tool, as well as its sustained publication over two decades. Since its inception in 2004, it has become one of the few openly accessible sources of company-level R&D investment data. Moreover it offers a detailed and timely overview of global corporate R&D trends.
The 2025 Scoreboard highlights several key trends. Firstly, the era of automotive companies as top R&D investors has ended. This era has been replaced by a new digital era dominated by five US-based ICT giants – Amazon, Alphabet, Meta, Microsoft, and Apple. Secondly, R&D investment is increasingly concentrated, particularly among these five firms. They now account for about 15% of global private R&D spending. A similar concentration is seen in their sales, patents, and profits.
Declining EU share and the internationalisation of R&D
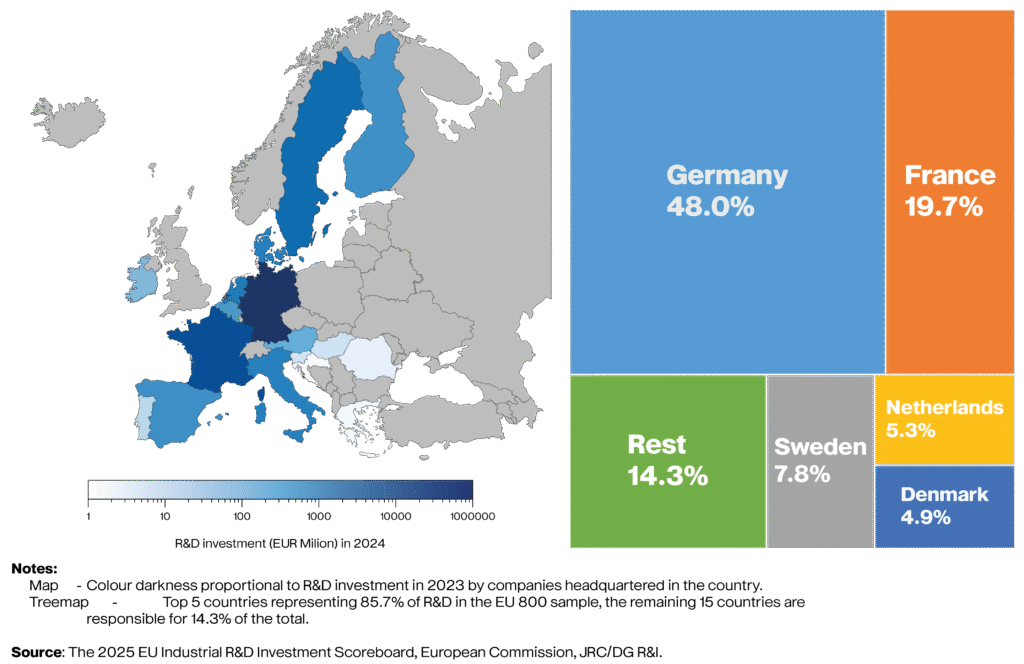
Despite this US dominance, the EU maintains a significant share of global private R&D, underscoring the importance of its industrial and innovative base. However, this share is declining, falling to 16.2% in 2024 from 21.4% a decade earlier. Germany and France are the primary drivers within the EU. Together, they contribute around 68% of the bloc’s total private R&D, with Sweden, the Netherlands, Denmark, and Italy also playing major roles.
A noteworthy update in this edition is the reclassification of R&D investment by the location where it is performed, rather than by a company’s legal headquarters. This shift reveals a more accurate picture, showing that R&D is increasingly conducted internationally. For instance, 14 companies representing €18 billion in R&D were reclassified out of the Netherlands, whose top investor, ASML, now ranks 57th globally. This reflects a broader, decades-long trend of R&D internationalization. While EU companies conduct a significant portion (averaging 14.3%) of their R&D in US affiliates, US companies direct a smaller and declining share (averaging 5.8%) of their R&D to the EU.
Key 2024 Figures
Globally, the top 2,000 companies invested €1,442.6 billion in R&D in 2024, with a 6.3% growth rate. The US and the Rest of the World led this growth (7.8% and 8.1% respectively), while the EU’s 2.9% was more moderate, similar to China’s 3.9%.
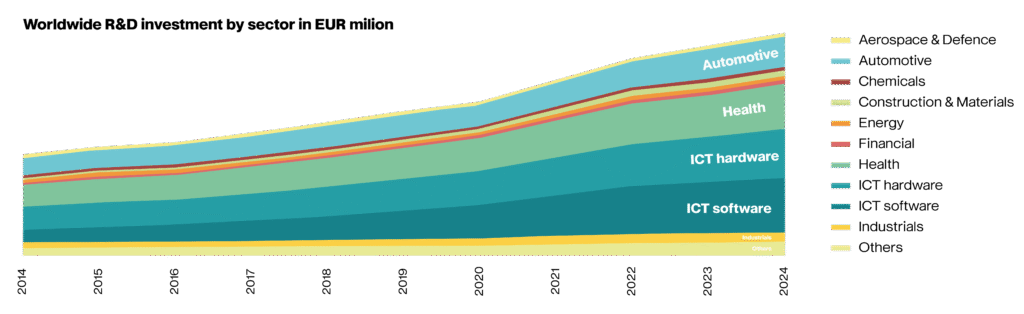
Investment remains highly concentrated. Over 80% of global R&D come from just four sectors: ICT software, ICT hardware, health, and automotive. US firms dominate ICT and health, while the EU maintains a global lead in automotive R&D.
EU R&D investment trends by sector
In 2024, total R&D investment by EU-headquartered companies was €233.8 billion, growing by just 2.9%—a significant drop from the 9.3% growth in 2023. Despite this slowdown, the EU’s health sector increased R&D investment by 13%, outperforming the United States (7.1%) and China (0.1%). Similarly, the EU energy sector saw a surge of 19.8%, far ahead of the US (6%) and China (3.8%). In contrast, R&D investment in the EU’s ICT sector declined by 8.9%. The EU’s largest R&D investor, the automotive industry (€87 billion), stagnated with growth of only 0.8%, lagging behind China (11.9%) and Japan (12.3%).
Global R&D Landscape: 2025 Scoreboard Snapshot
The world’s top 2,000 R&D-investing companies
• Geographic Spread: Headquartered across 45 countries
• Corporate Reach: Control over 500,000 subsidiaries
• Total R&D Investment (2024): €1,446 billion
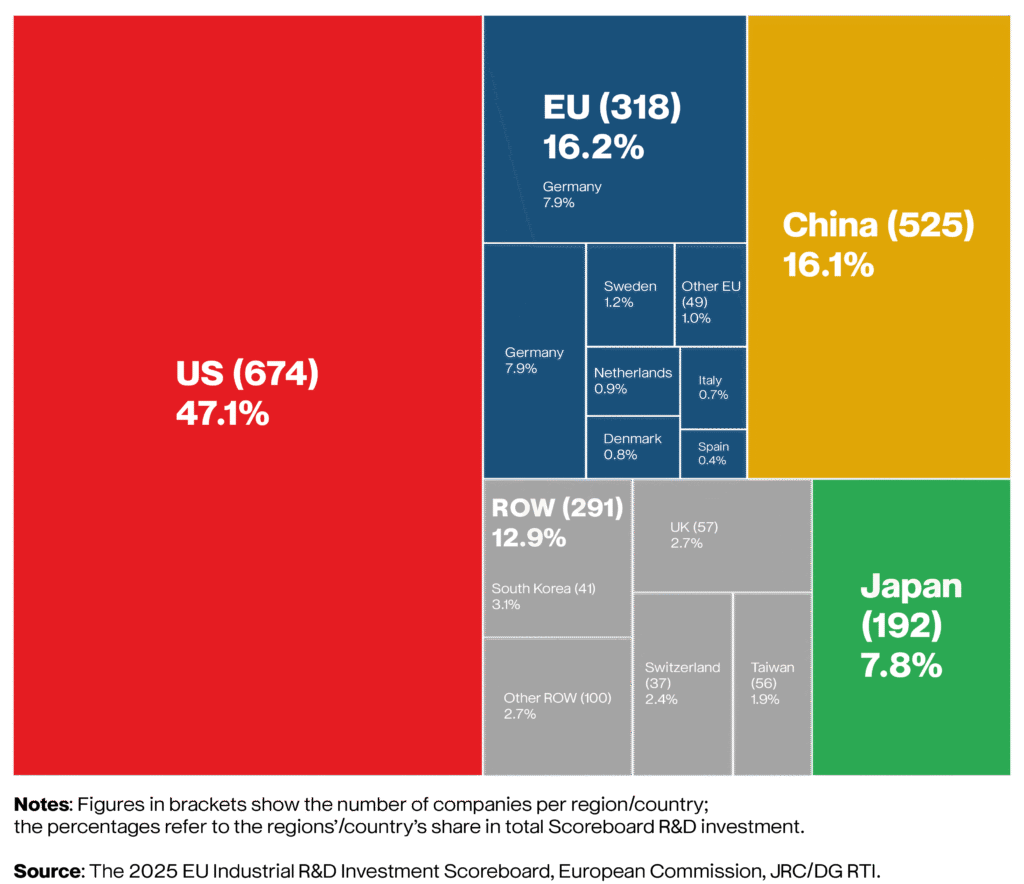
R&D Investment Share by Region:
• United States: 47.1% (674 companies)
• European Union: 16.2% (318 companies)
• China: 16.1% (525 companies)
• Japan: 7.8% (192 companies)
• Rest of the World: 12.9% (291 companies)
The ICT software sector accounted for 24.9% of global R&D investment, with US firms responsible for a dominant 77%—a level of concentration unprecedented since the Scoreboard began over two decades ago. Together, the four key sectors of ICT software (24.9%), ICT hardware (22.0%), health (19.9%), and automotive (13.6%) represent over 80% of all R&D investment. US companies lead in the first three (ICT software, hardware, and health), while EU firms maintain their global lead in automotive R&D but face growing challenges in ICT software.
R&D is also becoming increasingly concentrated among US tech giants. Since 2011, the top 5 companies have doubled their share of global R&D investment among the top 2,000 firms, now representing roughly 15% of the total. This concentration is mirrored in their financial dominance, with their share of profits rising from 3% to 15% and their share of sales growing from 2.3% to 6.6%.
CapEx Flows, innovation leaders and patents
Another key element is represented by Total Capital Expenditure (CapEx), which grew by 7.7%. This growth was primarily driven by US ICT software firms, whose CapEx surged by 50.5% as they raced to build data centers and related infrastructure for the AI boom. In contrast, EU energy companies also showed a strong increase in CapEx (up 23%), signaling a sustained focus on the green transition. Conversely, China’s overall CapEx fell by 2.2% – its first decline since 2016 – reflecting significant contractions in its construction & materials, automotive, and industrial sectors.
Innovation performance groups and R&D growth
This year’s analysis of the EU’s top 800 R&D-investing companies introduces a new perspective. It classifies them according to the European Innovation Scoreboard (EIS) performance groups: innovation leaders, strong innovators, and moderate innovators. The data reveals a clear correlation between a country’s innovation ecosystem and corporate R&D growth.
Over the past decade, companies based in innovation leader countries have achieved an average annual R&D investment growth of 6.8%. This significantly outpaces the growth seen in strong innovator countries (4.6%) and moderate innovator countries (2.5%). The analysis indicates that the robust framework conditions in innovation leader countries—such as access to talent, funding, and networks—effectively support the creation and scaling of small, R&D-intensive firms. In contrast, moderate innovator countries tend to see fewer new R&D-intensive entrants and lower R&D investment per employee.
The 2025 EU Industrial Research & Development (R&D) Investment Scoreboard just dropped, and it’s packed with key data on industry R&D investments in EU & in the world.
📈 Dive into the figures: https://t.co/4VOvCDSLcH pic.twitter.com/KnqOMYCaJE
— EU Science & Innovation 🇪🇺 (@EUScienceInnov) December 22, 2025
A revised analysis of green patenting confirms that EU companies maintain a global leadership position in green inventions related to circularity, energy-intensive industries, and clean transport. However, they lag in inventions at the intersection of the green and digital transformations, known as the twin transition.
In terms of cumulative international green patent filings, the EU continues to lead alongside Japan, although China is rapidly catching up. As of 2021, the EU’s specialization is evident in energy-intensive industries and circularity, while it ranks second to Japan in clean transport. Its primary area of underperformance remains in twin transition technologies.
Within the EU, Germany and France are the dominant contributors across most key green technology areas. Meanwhile, several other Member States—notably Sweden, Finland, and Ireland—demonstrate particular strengths in the twin transition domain.
From scoreboard to strategy
«The 2025 Industrial R&D Investment Scoreboard is clear», stated Ekaterina Zaharieva, Commissioner for Startups, Research and Innovation. «We must ensure that new technologies are developed, deployed and scaled across our economy. Today, energy is the fastest growing sector in R&D investments in the EU. Now we must strengthen our innovation ecosystems and boost our startups and SMEs so that they can contribute to our competitiveness and prosperity».
EU strategic response and innovation policy framework
The EU’s response has been multi-faceted, yet still appears insufficient to close the gap. A cornerstone is The European Commission’s Competitiveness Compass, adopted on 29 January 2025, representing the most significant policy response to the Draghi (2024) report. Its overarching principle for EU action is built on three imperatives: closing the innovation gap, creating a joint roadmap for decarbonization and competitiveness, and reducing dependencies while enhancing security.
This is complemented by a suite of other key initiatives, including the EU Startup and Scaleup Strategy, the Advanced Materials Act and Apply AI Strategy, the Clean Industrial Deal, and the forthcoming European Innovation Act (expected in Q1 2026), which will promote regulatory sandboxes and innovation-friendly policymaking. Furthermore, there is enhanced defence R&D spending across OECD countries, with the EU developing its White Paper on the Future of European Defence.
The effectiveness of these policy initiatives will be crucial for maintaining Europe’s competitive position as global R&D spending continues to grow, underscoring the urgency of implementing effective policies to enhance European industrial competitiveness in an increasingly challenging global environment.
Multinational R&D specialisation and long-term competitiveness
In her article The New Comparative Advantage: How Multinational R&D Shapes Innovation, Catherine McGuire, a Professor of Computer Science and AI Systems at the Gordon School of Business, part of the Swiss Institute of Artificial Intelligence (SIAI), frames the broader strategic context.
«Top firms fund most business R&D», she wrote. «Manufacturing is focused on a few areas. The process between them influences what is used in schools». She argues that multinational R&D specialization organizes this entire process. «It matches tasks with resources and supports idea growth by placing science, engineering, and production where they work best».
In her view, education systems need a steady flow of innovation, prototypes, and production, governed by rules that ensure security and fairness. «Organizations that follow this model will shorten product cycles and protect their values», McGuire added. She concludes with a clear imperative: «The alternative is to keep changing purchase plans while the world moves forward. Plan for multinational R&D specialization, buy accordingly, and regulate with it in mind. That is how to turn ideas into affordable learning at scale».


